Data visualization turns complex data into easy-to-understand graphics like maps, charts, and graphs. This helps people make quick, informed decisions. Tools for data visualization offer features like AI, collaboration, and interactive exploration.
According to a Fortune Business Insights report, the market for data visualization was $8.85 billion in 2019. By 2027, it’s expected to hit $19.20 billion, growing at a 10.2% annual rate. This growth is fueled by smartphones, the internet, Machine Learning, and cloud computing.
Table of Contents
What Are Data Visualization Tools?
Definition and Purpose
Data visualization tools help users turn data into visual forms. They are key for marketers to understand complex data, communicate better, and make their campaigns more engaging. These tools make it easier to understand data, speed up decisions, and explore data deeply.
Top data visualization tools include Google Charts, Tableau, Grafana, Chartist, FusionCharts, Datawrapper, Infogram, and ChartBlocks. They support various visual styles, are easy to use, and handle big data well.
- Data visualization tools are not just for data teams. They help management show the structure and hierarchy of an organization.
- Harvard Business Review lists four main uses of data visualization: generating ideas, illustrating ideas, discovering insights, and everyday use.
- Data visualization is crucial in the data science process. It helps teams and individuals share data effectively with others.
The history of data visualization goes back to ancient Egypt, before the 17th century. It was first used for navigation. Dashboards are great for tracking data from various sources, showing how certain actions affect performance.

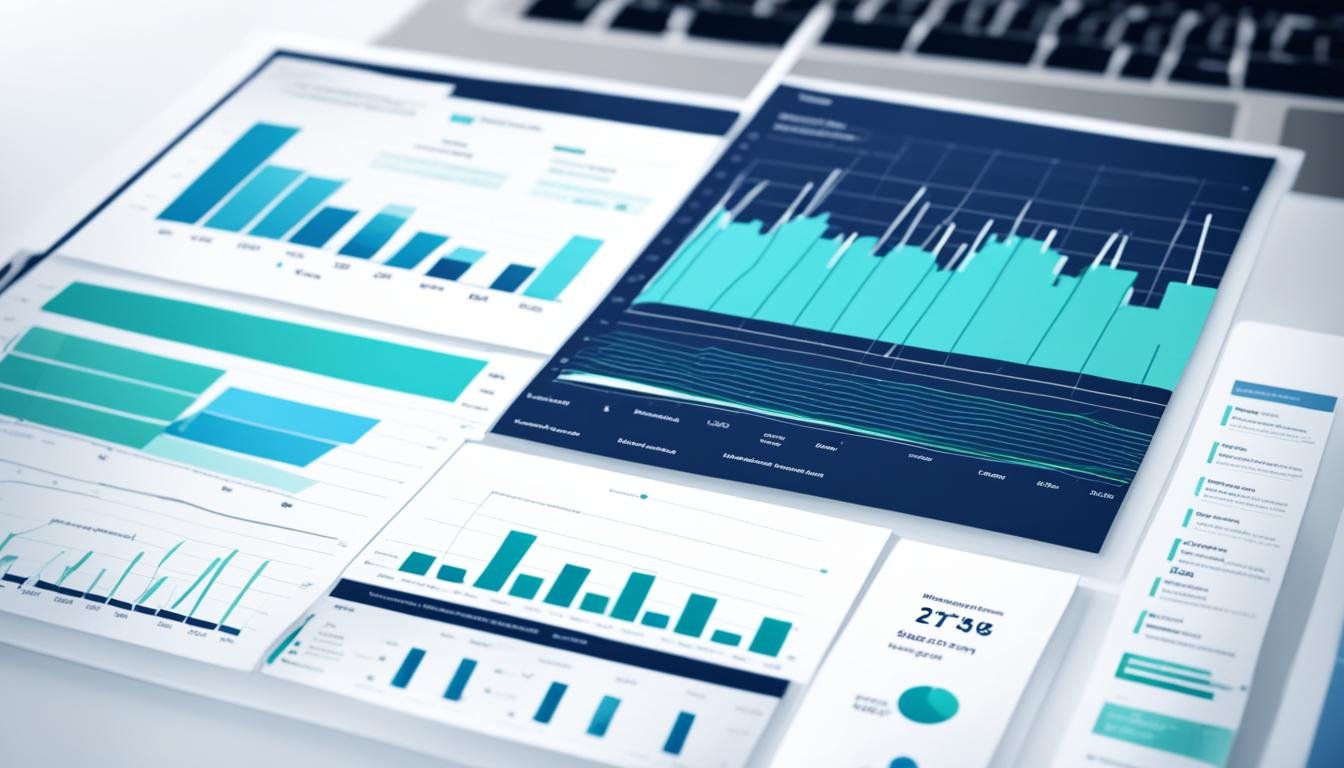
This image from freepik
Open source tools like D3.js, ECharts, Vega, and deck.gl offer dynamic and interactive ways to visualize data.
“Data visualization is essential for analyzing data and making decisions.”
Good data visualization practices include setting the context, knowing your audience, picking the right visual, and keeping it simple for clarity.
Data Visualization Tools and Market Growth
The data visualization market is growing fast. This is because more people want to use visual tools to understand data. This need is seen in all kinds of organizations.
Smartphones, the internet, and new tech like machine learning are making this trend stronger. Cloud computing and the Internet of Things (IoT) are also playing a big role.
A recent report by Fortune Business Insights found the market size was $8.85 billion in 2019. By 2027, it’s expected to hit $19.20 billion, growing at a 10.2% annual rate. This shows how crucial data visualization tools are becoming for businesses and individuals.
| Metric | Value | Growth Rate |
|---|---|---|
| Data Visualization Market Size (2019) | $8.85 billion | – |
| Data Visualization Market Size (2027 Forecast) | $19.20 billion | 10.2% CAGR |
The data visualization market is growing for many reasons, including:
- Increasing demand for smart factory solutions and visual analytics
- Widespread adoption of information visualization and scientific visualization in organizations
- Proliferation of smartphones and growing internet usage
- Rapid advancements in machine learning and the rise of cloud computing and IoT
As data amounts keep growing, the need for data visualization tools will also grow. These tools help in market research and making strategic decisions.

Top Data Visualization Tools
Popular Choices and Features
Data visualization tools are key for making sense of market research data. Top picks include Tableau, Dundas BI, JupyteR, Zoho Reports, Google Charts, Visual.ly, RAW, IBM Watson, Sisense, and Plotly. These tools help marketers and analysts find valuable insights in their data.
These tools are great at making data look good with charts, graphs, and dashboards. They’re easy to use, fast, and work with many data sources. Some are even mobile-friendly and have communities for help.
Prices and customization options vary, with some offering free plans or different subscription levels. Some tools have advanced features like predictive analytics, 3D charts, and teamwork tools. The choice depends on what you need and your budget.
When picking a data visualization tool, think about what you need to analyze, how much you want to customize, and your team size. Knowing what each tool offers helps you find the best one for your data and market research.
| Tool | Pricing | Key Features |
|---|---|---|
| Tableau | Tableau Creator: $75/license/month Tableau Explorer: $42/license/month Tableau Viewer: $15/user | Powerful data visualization, free Tableau Public platform, integration with various data sources |
| HubSpot Marketing Analytics | Pricing information not provided | Streamlined insights and data tracking, AI-powered SEO optimization suggestions, suitable for marketing managers, agencies, and CEOs |
| Microsoft Power BI | Pricing information not provided | Seamless integration with other Microsoft products, powerful data modeling capabilities, but steep learning curve |
| Chartio | Pricing information not provided | Affordable and easy-to-use business intelligence tool, Visual SQL for data querying, dynamic dashboards, and in-dashboard commenting for collaboration |

“An average person creates 1.7 MB of data per second, making data visualization tools essential for analyzing and understanding market research data.”
Choosing the Right Data Visualization Tools
When picking the best data visualization tools for your market research, think about what you need. You want tools that are easy to use but still powerful. They should match your specific needs.
It’s important to look at how flexible and easy to use the tools are. Tools that are very flexible are great for experts in data analysis and coding. But, if your team isn’t tech-savvy, you’ll want tools that are easy for anyone to use. This depends on your team’s skills and the type of market research you’re doing.
Also, check how well the tools help with visual analytics and telling stories with data. Tools for visual analytics are perfect for those who work with lots of data. They help in exploring and finding new insights. On the other hand, tools for data storytelling are great for sharing findings with others. They’re perfect for business users and experts who need to communicate their results clearly.
- Flexibility vs. Easy to Use: Tools focused on flexibility cater to experienced data analysts and developers, while tools emphasizing user-friendliness are suitable for non-technical business users.
- Visual Analytics/Exploration vs. Data Storytelling/Explanation: Visual analytics tools are best for data analysts and data scientists, while data storytelling tools are ideal for business users, consultants, and subject matter experts.
Think about whether the tools offer just visualizations or full applications and dashboards. Tools for standalone visualizations are great for journalists, students, and those in marketing. But, if you need to create dashboards for your team or present findings, look for tools that help with that.
Lastly, consider the cost of the tools. Some offer free versions with limits, while others give you full features for a short time. By looking at these factors, you can find the data visualization tools that meet your market research and decision-making needs.

Conclusion
Data visualization tools are key in today’s expanding data world. They help marketers understand the huge amounts of data from their marketing and sales. These tools turn complex data into visuals, making it easier and quicker to make decisions. This leads to better strategies and outcomes for businesses.
The market for data visualization is growing fast. This is thanks to more smartphones, better machine learning, and more cloud computing and Internet of Things use. Marketers need to pick the right data visualization tools for their needs and goals as the market changes.
This article talked about tools like interactive dashboards and customizable charts and maps. These tools have many features for market research needs. Using data visualization can give you deep insights, improve communication, and help you make better decisions for your business.